
Lesson 2
Work with a list
By the end of this lesson the table shows the numbers you compare companies on, in the order you want them, with the room they need — and you can take the whole thing out as a spreadsheet.
Open the screener1Tabs are open documents
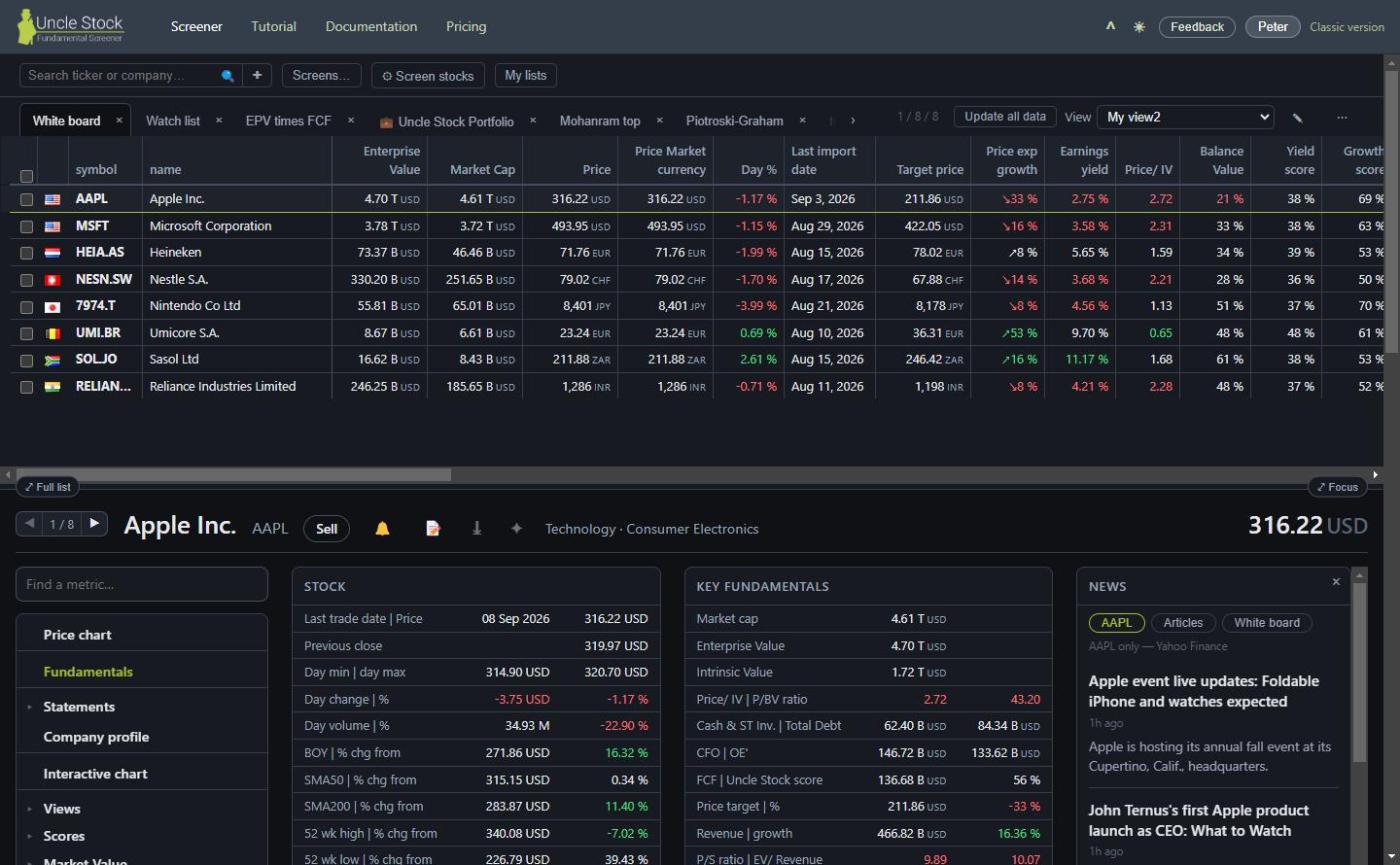
The strip under the toolbar holds everything you have open: the White board, your stock lists, the results of screens, and result lists you arrived at through a link. Switching tabs keeps everything else where it was.
When there are more tabs than fit, arrows appear at the ends of the strip. Only the tabs scroll — the controls on the right stay put.
 1
2
3
4
5
6
1
2
3
4
5
6
- The open documents
- The counter
- The View picker
- ✎ and ⋯
- The table
- The splitter
2Views are column sets
The View picker on the right of the tab row decides which columns the table shows. It holds four kinds of view:
- My views — the ones you built yourself, listed first.
- Uncle Stock views — general-purpose sets like Popular, Old School Value and Trading, plus one per score.
- Gurus — the metrics a particular investor is known for: Warren Buffett, Peter Lynch, Benjamin Graham, Joel Greenblatt, Tobias Carlisle, Terry Smith and a dozen more.
- Industries — sets for businesses that cannot be read with ordinary ratios, such as banks and insurers.
The guru views are a fast way to borrow someone's lens. Put a company you know well in a list, then step through Buffett, Lynch and Graham: the same company, three sets of questions.
A view belongs to the list, not to the app
Choosing a view changes the columns of this list and leaves your other lists alone. It also becomes your default for the next list you open. So a portfolio can sit in Trading while a screen result sits in Popular, and neither disturbs the other.
3Build your own columns Silver
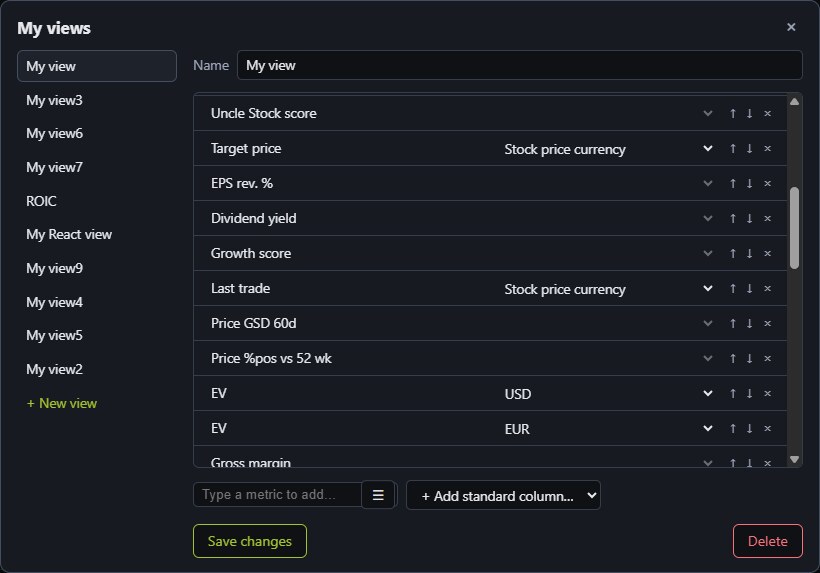
The ✎ in the ⋯ menu beside the picker opens the view editor. Add columns — fixed ones like ticker, market cap or country, or any metric in Uncle Stock — drag them into the order you want, name the set and save it.
A Silver pack keeps one personal view, Gold keeps several. Whatever you save shows up under My views, and works in the classic client too.
Each money column has its own currency
Beside every column that holds money sits a small drop-down. Three of its choices are not currencies but rules: Stock price currency follows the market the share trades on, Market currency follows its exchange — the two differ where a share is quoted in pence on an exchange that counts in pounds — and Currency of the financial results follows the books the company keeps. Below them is the list of currencies, for a column you want in one currency for every row.
Leaving the choice on its default is what most columns want: an amount such as market cap or total assets is shown in US dollars, so the rows compare, while a per-share figure stays in the currency the share is quoted in. The drop-down names which of the two that column uses, so you never have to guess.
4Sorting, counting, selecting
Click a column header to sort on it. The counter on the right reads selected / shown / total found — which row you are on, how many are loaded, and how many the screen actually matched. Those last two differ on purpose: rows load in pages, because computing them is the expensive part.
Tick rows to act on several at once. What you can then do depends on where you are: add them to a list, or take them out of this one.
5Marks in the rows
Next to a ticker you may see a small mark. Each means something specific:
- ▼ the price has dropped below your buy limit, ▲ it has risen above your sell limit. Hover it and the limit itself is in the tooltip. Setting those is lesson 7.
- A turning marker means Uncle Stock is recomputing that company right now.
- A dot means an import is running for it.
6Give the table room
The list and the company detail below it share the window. Drag the bar between them to change the split, or skip the dragging: Hide the detail gives the list the whole window, Hide the list does the reverse. Your split is remembered.
7Take the data with you Gold
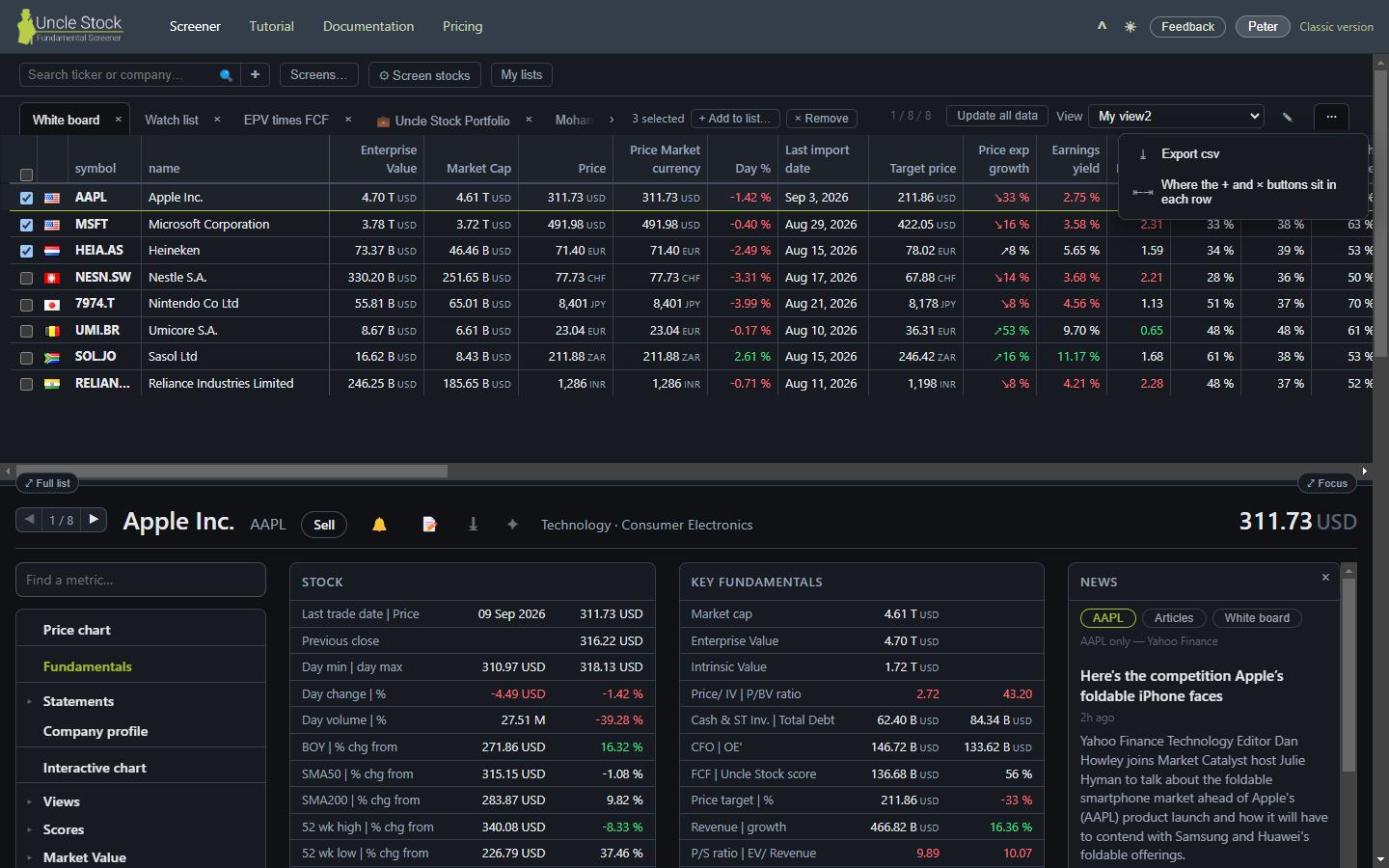
The ⋯ menu on the right holds ⤓ csv. It exports what you are looking at — a list or a screen result, in the current view's columns — as a spreadsheet.
The same menu is where you choose where the row's + and × buttons sit. It sounds trivial until you scroll a wide view sideways and find the button has left the screen.
8Two things that are quietly useful
Date cells are links
Most cells select the row. The date columns — when the results are as of, when the company was last updated, last imported, last calculated, when earnings are announced — open that company's profile instead, where the same fact stands in full.
Update all data Silver
Update all data loads the missing company data for every row on screen and asks for a fresh import wherever the source figures have gone stale. It takes a while. What you get for it is a list that opens instantly afterwards — worth starting before you go and make coffee, not worth waiting on.
The table compares companies. The next lesson goes the other way and takes one of them apart.